Pre-publication draft, Version 2.0, shared for expert review and comment Incorporating new reporting and analysis through March 25, 2026
Dear Readers:
What Have We Done?
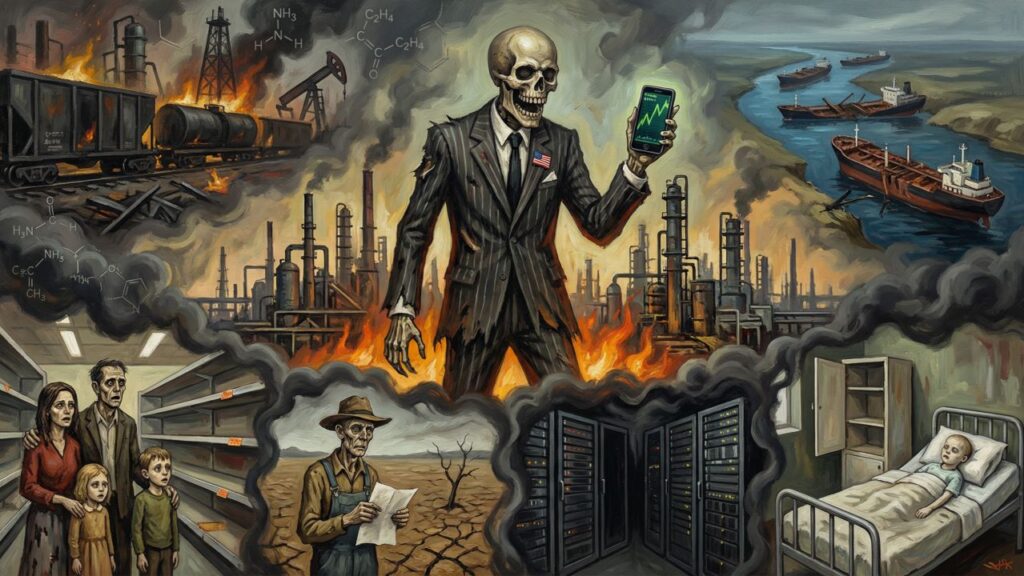
The bombs have already fallen. The damage is already done. And most of America has no idea what was just destroyed on their behalf.
This is not a war story. It is a chemistry story. And the chemistry does not care about press conferences, ceasefire negotiations, or what the cable news cycle decides to cover next week.
Here is what I need you to understand right now.
The industrial complex that was struck at Ras Laffan and South Pars is not an oil field. It is the molecular backbone of the global economy. It produces the ammonia that grows the food that feeds half of humanity. It produces the condensate that becomes the naphtha that becomes the polyethylene in every piece of plastic you touched today. It produces the helium that makes the semiconductor chips inside every device you own. It produces the sulfur that processes the nickel that goes into every battery in every electric vehicle the green energy revolution promised you.
All of it. From one geographic chokepoint. Now offline or severely disrupted.
And here is the part that should make every American who was promised an AI-powered economic renaissance stop cold: artificial intelligence runs on electricity, and American electricity runs on natural gas, and natural gas just became a global bidding war that American consumers are going to lose to export markets every single day this conflict continues.
You were sold the AI miracle as the answer to everything. Nobody told you the miracle requires cheap energy. Nobody told you cheap energy requires a stable world. Nobody told you the world was about to become significantly less stable, by American decision, without a plan for what comes next.
The inflation you are about to experience is not a Federal Reserve problem. The Fed cannot grow ammonia. The Treasury cannot synthesize helium. Congress cannot legislate a new condensate stream into existence. These are physical supply destructions governed by chemistry and geology, not by monetary policy. The economists comparing what is coming to the 1970s stagflation are being optimistic. The 1970s had one commodity shock. This one runs simultaneously through food, energy, plastics, metals, pharmaceuticals, and semiconductors. Simultaneously. Right now. Already in motion.
The spring planting window closes in six weeks. The fertilizer that was not ordered, or not delivered, or priced out of reach by this conflict does not grow a 2026 corn crop. That yield is already gone. The food price increases hitting American grocery stores this fall were decided in February and March 2026, by people who gave no apparent thought to what a Haber-Bosch synthesis loop actually is or why its disruption matters.
Forty-five million additional people will be pushed into acute hunger if this conflict runs through mid-year. That is the UN World Food Programme’s estimate. Forty-five million specific human beings who were eating before February 28th.
This is what happens when you launch a war without a plan. Not without a good plan. Without any plan. When the targeting list was complete and the launch window was selected and nobody in the room apparently asked: what happens to the global naphtha supply? What happens to Indonesian nickel processing? What happens to European gas storage going into winter? What happens to the helium supply for Samsung and TSMC? What happens to Indian generic drug manufacturers? What is the agricultural calendar implication of disrupting the Middle East’s fertilizer export complex three weeks before northern hemisphere spring planting?
Nobody asked. Or if they asked, nobody answered. Or if they answered, nobody listened.
I have spent months documenting exactly what this disruption means, molecule by molecule, supply chain by supply chain, country by country. The full analysis is linked below. It is long. It is technical. It is sourced. Read it and share it, because the people making these decisions are counting on the fact that most Americans cannot connect a Ras Laffan force majeure to the price of bread in October.
Prove them wrong.
The body still looks like it is sleeping. But the chemistry has already started. The rigor mortis of the global supply chain is setting in, irreversibly, right now, while the news cycle moves on to the next outrage.
Wake up. Read the article. Share it with everyone who will listen.
The molecules do not wait. Neither should we to stop this.
Most kindly,
Scott Ortkiese |www.throughlinesynthesis.com |so@throughlinesynthesis.com
Introduction:
The dominant media framing of the Persian Gulf conflict centers on crude oil prices and energy security. This framing misses the more consequential story. The disruption underway is not primarily an energy story. It is a molecular one, a cascade of supply failures in ammonia, sulfur, methanol, condensate-derived naphtha, industrial gases, petrochemical feedstocks, pharmaceutical precursors, and construction materials that are structurally embedded in the global food system, the advanced materials economy, and the industrial infrastructure now facing the largest reconstruction demand in a generation. This article examines those cascades in technical detail, traces their economic consequences across twelve national economies, projects the disruption forward on a 30-to-180-day horizon, and analyzes the structural realignment in both industrial policy and global trade architecture that they are now accelerating.
The analysis begins with a structural observation that has been absent from virtually every mainstream account of this conflict: the South Pars and North Field complex is not simply a natural gas reservoir. It is the world’s largest gas-condensate system, and the condensate stream it produces is as consequential to the global industrial economy as the gas stream itself.
I. The Gas That Holds the Economy Together
Begin with helium, not because it is the largest market affected by the disruption of Persian Gulf industrial infrastructure, but because it is the clearest demonstration of how the molecular dependencies undergirding the modern economy have been systematically obscured from public and policy discourse.
Helium is not manufactured. It cannot be synthesized at any scale relevant to industrial demand. It is produced, slowly and irreversibly, through the radioactive decay of uranium and thorium deep within the Earth’s crust, a process measured in geological time, not industrial quarters. Alpha particles shed by decaying uranium nuclei are, in structural terms, helium-4 nuclei. Over millions of years, those particles accumulate in the same underground formations that trap natural gas, sealed by impermeable caprock. The helium is recovered as a co-product of natural gas extraction and processing. Release it to open air, and it rises, reaches escape velocity, and departs the atmosphere permanently. It is, by physical law, a non-renewable resource whose accessible reserves several geologists have estimated will be exhausted within twenty-five to thirty years at current consumption rates.
The industrial significance of helium is difficult to overstate. In semiconductor fabrication facilities, the precision-controlled environments where logic chips and memory chips are produced, helium performs functions for which no substitute currently exists. It is used to purge and cool the internal environments of deposition equipment, and to maintain the cryogenic temperatures required at specific process steps. Its combination of chemical inertness and extraordinary thermal conductivity is not replicated by any other gas at industrial cost. When helium supply tightens, fabrication yields fall, meaning more defective dies per wafer, higher unit cost, reduced output volume. The constraint is not economic. It is physical.
Qatar’s Ras Laffan Industrial City is the world’s dominant helium production complex, extracting helium as a co-product of processing the North Field’s natural gas, the largest single natural gas reservoir on Earth. South Korea, home to Samsung and SK Hynix, which together produce approximately two-thirds of the world’s DRAM and NAND memory including the High Bandwidth Memory modules that power every major AI data center on the planet, sourced 64.7 percent of its helium imports from Qatar prior to the conflict. Taiwan’s TSMC, which fabricates 90 percent of the world’s most advanced logic chips and accounts for approximately 9 to 10 percent of Taiwan’s total national electricity consumption, procured 69 percent of its helium from Gulf Cooperation Council nations in 2024.
The cascade that followed February 28, 2026, and the subsequent Iranian strikes on Ras Laffan on March 19, requires no elaboration for readers with industrial familiarity. QatarEnergy declared force majeure. The world’s dominant helium production node went offline. An industry analysis cited by CNBC estimated that the conflict has taken approximately 27 percent of the world’s helium supply offline, with a minimum two-to-three-month shutdown of production and four-to-six months before supply chains normalize under any optimistic scenario. Fitch Ratings formally flagged prolonged helium supply disruption as a tail risk for the semiconductor sector as early as March 16.
Beyond helium, South Korea’s industry ministry identified fourteen additional semiconductor supply chain materials with heavy exposure to the conflict, including bromine, of which 66 percent of global supply originates in Israel and Jordan, as well as specialty gases, naphtha feedstocks, and chip inspection equipment components. The Seoul government placed all fourteen items under emergency monitoring. The Korea Semiconductor Industry Association issued a statement asserting short-term sufficiency while simultaneously calling for accelerated diversification, a formulation that accurately describes the current position: adequate for now, structurally precarious beyond the current inventory horizon.
The downstream consequences extend to every product category that sits below semiconductor fabrication in the value chain: AI infrastructure, automotive electronics, medical devices, telecommunications equipment, and defense systems. The United States Congress appropriated 52 billion dollars under the CHIPS Act to secure domestic semiconductor supply chains. The conflict has now placed the primary fabrication inputs for the United States’ closest allied chip producers in acute jeopardy.
Helium is the opening case. The logic that makes it a crisis, namely geographic concentration of production, structural industrial dependency, absence of substitution options, and long lead times for alternative supply development, extends with varying intensity across every molecule examined in this article.
II. The Condensate Economy: The Missing Story in Every Mainstream Account
There is a molecular story running in parallel to the gas and oil narratives that has received almost no analytical attention in mainstream coverage of the conflict. It begins with a basic geochemical fact about the South Pars and North Field reservoir system: this is not a natural gas field that happens to produce some liquid. It is a gas-condensate system of exceptional richness, and the liquid co-product, the C5+ hydrocarbon condensate stream separated during gas processing, is the upstream source of the naphtha feedstock that powers the Asian petrochemical industry.
When natural gas is produced from a reservoir containing heavier hydrocarbon molecules dissolved under subsurface pressure, those heavier components, pentane and heavier carbon chains collectively designated C5+, drop out of the gas phase as pressure falls during processing. This liquid fraction, known as natural gas condensate or simply condensate, is chemically distinct from crude oil. It is ultra-light, low in sulfur, and extraordinarily rich in the naphtha-range hydrocarbons, roughly carbon-5 through carbon-9, that are the preferred feedstock for the steam crackers that produce the world’s ethylene and propylene.
The South Pars and North Field Khuff reservoirs are notable precisely because their condensate yield is high relative to most other gas-producing formations worldwide. Iran’s South Pars complex was producing more than 710,000 barrels per day of gas condensate as of early 2025, making it one of the largest single condensate production points on the planet. Qatar’s Ras Laffan condensate output, processed primarily through the Laffan Refinery which produces naphtha, jet fuel, kerosene, diesel, and LPG from condensate feedstock, has been an anchor of Asian petrochemical supply for more than a decade. The economics of this condensate stream are so favorable that the associated revenues can, by themselves, justify major infrastructure investments that would be uneconomic on gas economics alone. As one process engineer with direct knowledge of Qatar North Field development has observed, the condensate production from a North Field gas development would have paid for a major regional pipeline on its own terms, a measure of the stream’s commercial significance that the gas-focused media narrative systematically ignores.
The Laffan Refinery at Ras Laffan was designed to take this condensate stream and convert it into transportation fuels and, critically, naphtha for export to Asian petrochemical buyers. With Ras Laffan damaged and under force majeure, that refinery’s condensate processing capacity has been reduced. Iranian condensate exports, which were themselves a major source of naphtha feedstock for Asian crackers, have come to a complete standstill. The combined effect is a naphtha supply shock running in parallel to, and largely unreported alongside, the gas and oil price shock that has dominated media coverage.
The downstream consequences are now visible in every petrochemical market in Asia. Naphtha prices have surged roughly 50 percent since late February to approximately 875 dollars per ton, according to S&P Global Energy. South Korea and Japan depend on imports for approximately two-thirds of their naphtha consumption, and approximately 60 percent of South Korea’s naphtha imports came from the Persian Gulf before the conflict. Asia as a whole imported 86.6 million metric tons of naphtha in 2025, of which more than half originated in the Middle East. ICIS describes Middle Eastern naphtha as the feedstock on which Asia’s petrochemical heartland was built, and that feedstock is now substantially offline.
The cracker complex that processes this naphtha into ethylene and propylene is among the most capital-intensive industrial infrastructure in the world. Asian steam crackers cannot switch feedstocks in real time. They are engineered for a specific feedstock slate: naphtha crackers produce ethylene alongside propylene, butadiene, and the aromatic co-products benzene, toluene, and mixed xylenes that are the upstream inputs to plastics, synthetic fibers, adhesives, solvents, and rubber. When naphtha supply is disrupted, it is not just ethylene production that falls; it is the entire co-product slate, including propylene for polypropylene, butadiene for synthetic rubber, and aromatics for everything from nylon to polyurethane foam to the terephthalic acid in PET bottles and polyester clothing.
Force majeures are already being declared across the Asian cracker complex. Yeochun NCC, South Korea’s largest ethylene producer, has officially declared force majeure. Lotte Chemical, LG Chem, and Hanwha Solutions are reviewing similar measures. Indonesia’s Chandra Asri Pacific has made similar declarations. Bloomberg confirmed on March 19 that the Iran war was driving up prices for the plastics ingredient ethylene. By March 22, the Seoul Economic Daily was documenting plastic supply fears in consumer product categories as specific as pay-as-you-throw garbage bags, which are manufactured from polyethylene derived from naphtha-cracked ethylene and whose domestic manufacturers in South Korea hold approximately one month of raw material inventory.
The US Ethane Partial Offset and Its Structural Limits
The United States petrochemical complex provides a partial offset to the Asian feedstock crisis, but the nature of that offset reveals an important structural asymmetry that has been misunderstood in most coverage.
U.S. Gulf Coast crackers are designed to run on ethane, the two-carbon fraction recovered from natural gas processing. Ethane pricing is linked to domestic natural gas, not to oil-linked feedstock prices. As naphtha and LPG prices spike globally due to the Hormuz disruption, U.S. ethane crackers are experiencing a margin expansion simply by continuing to operate, since their feedstock costs remain relatively flat while ethylene prices rise globally. East Daley Analytics documented this dynamic on March 24, noting that U.S. Gulf Coast ethylene producers are seeing margins expand as global feedstock economics shift in their favor, and that Chinese ethane crackers receiving steady inflows of U.S. ethane are similarly insulated from the LPG and naphtha price shock. An increase in U.S. non-associated gas production could alleviate some of the ethylene supply shortfall at the margins. The whole story, however, becomes wrapped around the overall reduction in gas supply and the molecular chemistry of what ethane crackers can and cannot produce.
The structural limit of this offset is feedstock chemistry. Ethane crackers produce ethylene and very little else, because the ethane molecule has only two carbons and thermal cracking produces essentially a single product stream. Naphtha crackers, by contrast, produce ethylene plus propylene, butadiene, benzene, toluene, and mixed xylenes from a single feedstock charge. The Asian petrochemical industry was built around the naphtha co-product slate because it needed all of these products simultaneously. U.S. ethane crackers can add ethylene supply to global markets, but they cannot substitute for the propylene, butadiene, and aromatics co-products that are simultaneously being cut by Asian naphtha cracker curtailments. The supply gap in polypropylene, synthetic rubber, nylon, polyester, and aromatic solvents cannot be filled by additional ethylene production from U.S. ethane.
There is also a geographic and infrastructure constraint. Additional U.S. ethylene cannot reach Asian consumers easily; it must travel as derivatives such as polyethylene pellets or ethylene glycol, and the conversion and shipping capacity is not elastic on a 30-to-90-day horizon. The U.S. ethane cracker advantage is real and commercially significant for U.S. producers. It is not a substitute for the missing naphtha condensate stream from South Pars and Ras Laffan.
The reconstruction of South Pars and Ras Laffan condensate processing capacity is therefore not simply a gas supply story. It is a naphtha supply story, a propylene supply story, an aromatics supply story, and a plastics supply story simultaneously. The full reconstruction requirement encompasses not just the LNG trains that have received the most media attention, but the condensate splitters, the naphtha fractionation units, the Laffan Refinery condensate processing infrastructure, and the full liquid hydrocarbon value chain that has been operating quietly for decades as the invisible feedstock backbone of Asian manufacturing.
Figure 1. The Molecular Web: From One Gas-Condensate Field to the Global Industrial Economy

III. Nitrogen, Hydrogen, and the Industrial Process That Feeds Half of Humanity
In 1909, Fritz Haber demonstrated in laboratory conditions that atmospheric nitrogen could be combined with hydrogen under high heat and pressure to produce ammonia. Carl Bosch industrialized the process at scale by 1913. Both men received the Nobel Prize in Chemistry. The Haber-Bosch process they created is, by reasonable measure, the most consequential industrial achievement of the twentieth century. It directly enabled the global population to grow from approximately 1.6 billion in 1900 to more than 8 billion today. Remove it, and the nitrogen atoms currently inside roughly half the world’s human population, fixed into the crops consumed across multiple generations, would not exist in biologically available form.
The Strait of Hormuz is, among other things, a critical chokepoint in the global food supply chain. To understand precisely why requires understanding Haber-Bosch at the molecular level.
The Hydrogen Source
The Haber-Bosch process requires hydrogen gas in enormous quantities. Approximately 72 percent of the world’s ammonia production uses natural gas as the hydrogen source, through Steam Methane Reforming. In the SMR reactor, methane and steam are passed over a nickel-based catalyst at temperatures between 700 and 1,000 degrees Celsius. The reaction produces carbon monoxide and hydrogen. A subsequent water-gas shift reaction recovers additional hydrogen. Carbon dioxide is removed by chemical scrubbing, leaving a high-purity hydrogen stream. Approximately 60 percent of the natural gas input to an ammonia plant functions as chemical feedstock, the molecular raw material from which the hydrogen atoms in ammonia are ultimately derived. The remaining 40 percent is combusted to generate the heat and compression energy the process requires.
This stoichiometry explains the structural dominance of Persian Gulf nations in global ammonia production. There is no economically competitive alternative to natural gas as a hydrogen source at current commercial scale. Electrolytic hydrogen production exists and is growing, but currently represents a small fraction of global ammonia production capacity. The Gulf’s advantage in ammonia production is not logistical. It is thermodynamic and feedstock-based.
The Nitrogen Source and Industrial Gas Co-Products
Nitrogen constitutes approximately 78 percent of atmospheric air. The challenge is not scarcity; it is activation energy. The triple bond between the two atoms of atmospheric nitrogen is among the strongest in chemistry, requiring the Haber-Bosch reactor’s combination of 300 to 500 degrees Celsius operating temperature, 150 to 300 atmospheres of pressure, and an iron-based catalyst with potassium and aluminum oxide promoters to break.
Nitrogen feed for ammonia synthesis is produced in large Air Separation Units adjacent to the production facility. The cryogenic air separation process exploits the different boiling points of air’s components. Atmospheric air is compressed, purified to remove moisture and carbon dioxide, then cooled to approximately negative 185 degrees Celsius, at which point it partially liquefies. Distillation in a two-column configuration separates components by volatility. High-purity nitrogen vapor exits the top of the high-pressure column.
This same cryogenic infrastructure produces the industrial gases that the entire advanced manufacturing economy depends upon: medical and steelmaking oxygen, precision-welding argon, and industrial nitrogen used across food packaging, pipeline inerting, and countless manufacturing processes. The ammonia plant’s air separation unit is simultaneously the source of the invisible molecular scaffolding of modern industry.
What Ammonia Becomes
From ammonia, the full portfolio of nitrogen-based fertilizers is derived. Urea, the world’s most widely traded nitrogen fertilizer, is produced by reacting ammonia with carbon dioxide. The resulting granules contain 46 percent nitrogen by weight. Diammonium phosphate and monoammonium phosphate are produced by reacting ammonia with phosphoric acid derived from phosphate rock treatment with sulfuric acid. This is where sulfur enters the fertilizer value chain: without sulfuric acid, phosphate rock cannot be converted to plant-available form. Morocco’s OCP, the world’s largest phosphate producer, imports 3.7 million metric tons of Gulf sulfur annually.
The Gulf’s five primary exporters, Iran, Qatar, Saudi Arabia, the UAE, and Bahrain, account for approximately 34 percent of global urea trade. The International Fertilizer Association estimates the broader Middle East supplies nearly 50 percent of globally traded urea. UNCTAD calculates that approximately one million tons per month of nitrogen compounds, ammonia, phosphates, and sulfur transit through the Strait of Hormuz. Bank of America warned that the conflict could affect 65 to 70 percent of global urea supplies, with prices up 30 to 40 percent in the initial weeks. The UN World Food Program projected that if the conflict continues through mid-year, an additional 45 million people could be pushed into acute hunger, taking the global total to 363 million, exceeding the record set at the onset of the Ukraine war in 2022.
The Price Signal and the Agricultural Calendar
Granular urea at the U.S. Gulf was elevated at 450 to 475 dollars per ton before the conflict began. Within days of the opening strikes, bids reached 520 to 550 dollars. Within a week, offers were being quoted at 700 dollars as spring planting demand collided with supply uncertainty. S&P Global’s granular urea benchmark rose 38.8 percent by March 13. Argus Media documents Middle East export benchmarks approximately 60 percent above year-ago levels.
The agricultural calendar operates with no diplomatic flexibility. The northern hemisphere spring planting window for corn and wheat runs from late March through May. Nitrogen fertilizer not applied by mid-May does not reduce yields; it eliminates them for the current season. University of Illinois agronomists estimate the corn yield penalty at up to 1.75 bushels per acre per day of planting delay past the end of April. The agronomic calendar is indifferent to ceasefire negotiations.
India presents the most acute national case. India imports 25 percent of its urea and even more of its phosphatic and potassic fertilizers. Eighty-six percent of the imported natural gas needed for domestic urea production comes from West Asia. The Indian government has been conducting emergency urea import tenders, ordering 1.35 million tons in an accelerated procurement cycle, and has made an unprecedented approach to China for emergency urea cargoes. The Fertiliser Association of India has warned that physical shortages are expected if the war continues into May and June.
IV. Sulfur, Nickel, and the Structural Materials Crisis
The HPAL Dependency Chain
In the modern battery materials supply chain, the conversion of raw nickel ore to battery-grade nickel sulfate passes through High-Pressure Acid Leach technology. Nickel-bearing laterite ores are dissolved in concentrated sulfuric acid at 250 to 270 degrees Celsius and 40 to 50 bar, releasing nickel and cobalt into solution for subsequent selective recovery and purification. Sulfuric acid is produced by combusting elemental sulfur, oxidizing the resulting sulfur dioxide to sulfur trioxide over vanadium pentoxide catalysts via the Contact Process, and absorbing the product in water.
Indonesia, the world’s largest nickel producer accounting for more than 50 percent of global output, imports approximately 75 percent of its sulfur from the Middle East, the majority transiting through the Strait of Hormuz. HPAL facilities typically hold one to two months of sulfur inventory. S&P Global Market Intelligence documented that Indonesia imported over 5.2 million metric tons of sulfur in 2025, a 44 percent year-on-year increase driven by HPAL capacity expansion. That expansion has made Indonesia simultaneously more critical to global battery supply chains and more structurally dependent on Gulf sulfur at the precise moment Gulf supply is in question. CRU Group’s most recent sulfur market analysis describes price forecasts as having been revised radically higher following the Ras Laffan strikes.
Sulfur is now being rationed across three competing user categories simultaneously: Indonesian HPAL nickel processors, African copper miners, with the Democratic Republic of Congo having imported 1.3 to 1.4 million metric tons of Middle East sulfur annually, and global phosphate fertilizer producers. The allocation will be determined by price, meaning all three categories absorb significant cost increases.
The Reconstruction Demand for Nickel Steel: The Underanalyzed Opportunity
The sulfur crisis constrains nickel supply from the processing side. The conflict creates a simultaneous demand surge from the reconstruction side. This intersection has received almost no analytical attention in Western commodity markets.
LNG trains are immense cryogenic structures that cool natural gas to approximately negative 162 degrees Celsius for liquefaction and transport. LNG containment and cryogenic processing infrastructure requires 9 percent nickel steel, a specific alloy developed following the 1944 Cleveland LNG explosion, which resulted from the brittle fracture failure of a tank with insufficient nickel content. At cryogenic temperatures, standard carbon steel undergoes a ductile-to-brittle transition and fails under stress. Nine percent nickel content stabilizes a fine-grained microstructure that remains ductile at temperatures as low as negative 196 degrees Celsius. Approximately 65 percent of global nickel production flows into stainless steel production. There is no engineered substitute for nickel in cryogenic and corrosion-resistance applications where structural integrity is the design requirement.
QatarEnergy has confirmed that Iranian attacks damaged two of its fourteen LNG trains at Ras Laffan, with estimated repair timelines of three to five years. The Financial Times has described Ras Laffan as a massive industrial site three times the size of Paris, constructed over 30 years at a cost of hundreds of billions of dollars. South Pars, Iran’s principal gas processing complex representing 80 percent of the country’s domestic gas supply, faces potential long-term reconstruction requirements of a scale that has not yet been publicly modeled. Each damaged LNG train requires thousands of tons of 9 percent nickel steel plate, precision-fabricated cryogenic pipeline, high-alloy pressure vessels, heat exchanger bundles, instrumentation, and compressor trains. The structural dynamic is straightforward: nickel supply is constrained from the production side by the HPAL sulfur feedstock disruption, while nickel demand is simultaneously rising from the reconstruction side for years, not quarters.
V. Methanol: The Invisible Chemical Economy
The Strait of Hormuz controls an estimated 35 to 45 percent of global seaborne methanol exports, a proportional share that exceeds even its significance for crude oil. Iran is among the world’s largest methanol producers, with annual output exceeding 7 million metric tons, using the country’s vast natural gas reserves as feedstock. Saudi Arabia’s Ar-Razi facility, with annual capacity exceeding 4 million metric tons, has suspended supply under force majeure since the opening strikes. Iranian methanol exports have come to a complete standstill. ICIS reported that roughly 70 percent of China’s methanol seaborne imports were previously sourced from the region affected, and that methanol futures prices in China spiraled upward within the first week of the conflict.
Methanol is not a consumer product. It is the upstream precursor for formaldehyde in adhesives, resins, and building materials; acetic acid for plastics and textiles; MTBE and DME as fuel additives; the methanol-to-olefins pathway that China developed as a strategic hedge against naphtha dependency; and direct marine fuel under IMO sulfur regulations. China’s methanol-to-olefins capacity, a strategic investment built to reduce dependence on naphtha-derived olefins, now faces a feedstock disruption of its own, as both naphtha and methanol streams are simultaneously constrained by the same geographic chokepoint. The downstream consequences flow through plastics manufacturing, adhesives, construction materials, packaging, and marine fuel markets across Asia simultaneously.
VI. The Petrochemical and Pharmaceutical Cascades
The disruption the media has largely missed is the cascade from petroleum and condensate feedstock interruption into pharmaceutical supply chains. Active pharmaceutical ingredients, the biologically active molecules in finished drugs, are synthesized from chemical precursors that frequently derive from petrochemical intermediates: solvents, reagents, polymer excipients, packaging materials, and fermentation substrates. When petroleum supply tightens and refinery runs are cut, with Sinopec having reduced throughput by over 10 percent compared to initial projections, the Singapore Refining Company having reduced runs to 60 percent of capacity, and ExxonMobil’s Jurong Island refinery having dropped to approximately 50 percent, the downstream chemical intermediates that pharmaceutical manufacturers depend upon face price spikes and availability constraints.
India’s pharmaceutical industry is particularly exposed. India supplies approximately 40 percent of global generic medicines by volume, and its active pharmaceutical ingredient sector is the backbone of generic drug supply to both the United States and Europe. Indian industry executives have confirmed that API prices are rising, excipient and packaging material costs are increasing, and transport costs are elevated, all simultaneously. Air cargo costs from Asia to Europe have risen 45 percent since the war began. CNBC has specifically flagged the vulnerability of generic drug prescription availability in the United States if the conflict extends beyond the current inventory horizon.
The intersection of the pharmaceutical cascade with the agricultural one is in the fermentation and biologics sector. A prolonged fertilizer supply disruption does not simply raise food prices; it raises the cost of producing a subset of biologics and specialty pharmaceutical products that depend on fermentation feedstocks derived from agricultural inputs. The supply chain for human health runs, in part, through the same molecular infrastructure as the supply chain for human food.
VII. Beyond Energy: Aluminum, Sugar, Construction Materials, and Non-Energy Cascades
Up to 15 percent of goods passing through the Strait of Hormuz are non-energy materials. The Middle East accounted for approximately 21 percent of global unwrought aluminum imports and 13 percent of wrought aluminum imports in 2025, with Gulf smelters now either constrained by feedstock availability or unable to ship product through closed sea lanes. Aluminum prices are climbing, with input cost implications flowing into automotive, aerospace, construction, and food packaging sectors simultaneously.
Brazil faces a dual disruption: the Strait was a significant transit route for Brazilian sugar bound for Middle Eastern markets, and Iran was simultaneously Brazil’s largest corn export market. Brazilian farmers are now absorbing both the demand-side shock of lost Iranian corn exports and the supply-side shock of elevated fertilizer input costs, compressing agricultural margins across the country’s most important export commodity sectors.
Construction materials including cement, steel, concrete, and aluminum essential to infrastructure projects are either produced in the Middle East or require materials and energy that transit through it. Conflict surcharges, storage, handling, and war-risk insurance costs are compounding into project delays across every infrastructure market that depends on global construction material flows. For projects already under financial pressure from pre-conflict tariff-driven cost escalation, the combined effect threatens Final Investment Decision timelines across the global construction pipeline.
VIII. The Energy Export Mechanism and the Domestic Price Floor
There is a transmission mechanism between the Gulf disruption and domestic energy costs in the United States that has been inadequately communicated in policy discourse.
When Ras Laffan and South Pars reduce LNG supply to global markets, European buyers face acute shortfall. Dutch TTF natural gas futures spiked 70 percent in two trading days after the Ras Laffan strike, with the April 2026 contract touching 60 euros per megawatt-hour, nearly double the pre-war level. Atlantic LNG day rates hit 181,750 dollars following the strike. Asian buyers simultaneously face the same shortfall because Hormuz is closed to their Gulf deliveries. Both regions intensify competition for every available LNG cargo globally, creating significant arbitrage opportunity for U.S. LNG exporters, who respond by maximizing export volumes.
The United States entered 2026 with an unprecedented ramp in LNG export capacity. New facilities including Plaquemines LNG, Corpus Christi Stage 3, Golden Pass Train 1, and Port Arthur LNG are adding an estimated 6 to 8 billion cubic feet per day of incremental feedgas demand by year end. Each LNG cargo departing a U.S. Gulf Coast terminal represents a precise quantity of natural gas removed from the domestic supply balance. The New York Times documented that gasoline prices have surged approximately one dollar per gallon nationwide since the conflict began. Bloomberg formally flagged U.S. stagflation risk as the primary domestic macroeconomic consequence of the conflict.
EU gas storage stands at approximately 34 percent of capacity as of March 22, the lowest end-of-winter levels since the 2022 Russian gas crisis. The EU’s 90 percent storage mandate by November 1 requires injecting roughly 55 to 60 billion cubic meters between April and October, the largest seasonal refill the EU has ever attempted, in a market where the conflict has removed a significant fraction of available LNG supply. Futures through March 2027 are all trading above 60 euros per megawatt-hour, a signal that markets do not expect normalization anytime soon.
IX. The Tariff Architecture and Its Interaction with Supply Chain Stress
The current disruption did not arrive in a supply chain system at equilibrium. The trade policy environment of 2025 to 2026 had already imposed significant stress on global industrial supply chains before the conflict began.
Trade barriers implemented in 2025 were premised on the theory that unilateral tariff measures could accelerate domestic manufacturing reshoring without significant supply chain disruption costs. Supply chains built over decades to exploit comparative advantage, with industrial chemicals processed in the Gulf, critical minerals extracted and refined in Southeast Asia and Africa, and advanced manufacturing concentrated in East Asia, do not respond to tariffs by reshoring instantaneously. They respond by disrupting, delaying capital investment decisions, raising input prices, and triggering retaliatory measures that affect export markets for domestic producers.
The 25 percent secondary tariff on countries conducting business with Iran, announced in January 2026, created immediate pressure on trading relationships across Asia and Europe, requiring every major economy to evaluate a binary choice between its existing commercial architecture and its access to the U.S. market. That decision calculus was still in process when the military conflict began on February 28.
The combined effect is precisely what supply chain economists describe as an accelerant. For industries with long project investment cycles, including chemical process plants, LNG infrastructure, and industrial catalyst facilities, the combination of tariff-driven investment uncertainty and conflict-driven input cost inflation creates a paralysis dynamic that extends capital formation timelines and increases the cost of every project taken to Final Investment Decision.
X. A Nation-by-Nation Disruption Profile
Japan. Japan imports 87 percent of its energy supply, with 95 percent of its crude oil coming from the Middle East and approximately 70 percent of that transiting the Strait of Hormuz. The Japanese government has released oil from private-sector stockpiles and begun drawing from national reserves. Prime Minister Takaichi has ordered a thorough review of the entire ecosystem of oil-related products across the Japanese economy. Nuclear restarts, with 18 of 33 operable plants still closed, are being fast-tracked with new urgency. Japan holds 1.23 trillion dollars in U.S. Treasury bonds; its structural shift in energy procurement posture and reserve allocation decisions will have long-duration effects on U.S. interest rates that are not captured in any current energy price model.
South Korea. South Korea announced a record release of 22.46 million barrels from strategic reserves. Its semiconductor sector, which generated 173.4 billion dollars in exports in 2025, is the most exposed major industrial complex in the world to the helium supply disruption. The government placed 14 semiconductor input materials under emergency monitoring. Seoul is simultaneously conducting procurement outreach to U.S. and Russian helium suppliers, a sourcing posture that reflects a fundamental recalibration of strategic alignment logic. Naphtha at 875 dollars per ton has triggered force majeures across the cracker complex, with Yeochun NCC having officially declared force majeure and Lotte Chemical, LG Chem, and Hanwha Solutions all reviewing similar measures.
India. India entered the conflict with 25 days of oil reserves. A U.S. Treasury-issued 30-day waiver allowed India to purchase stranded Russian oil at sea to prevent a total fuel collapse. The Indian government is emergency-importing urea at accelerated timelines and has approached China for emergency urea cargoes. The pharmaceutical sector is experiencing API cost increases with knock-on effects on medicine pricing for the world’s largest volume supplier of generic drugs. The Fertiliser Association of India has warned that physical shortages are expected in specific regions if the conflict extends past May.
China. China is 85 percent energy self-sufficient and holds significant strategic petroleum reserves. However, Sinopec has cut throughput by over 10 percent relative to initial projections. CNOOC Shell Petrochemicals’ Huizhou cracker is shutting down a 1.2 million ton per year ethylene unit due to feedstock disruption. China’s methanol supply, previously 70 percent sourced from the Middle East on a seaborne basis, is under acute pressure. Beijing has simultaneously offered rhetorical support to Tehran and requested that Iran respect the reasonable energy concerns of neighboring countries, a diplomatic formulation that precisely reflects China’s desire to preserve commercial access to Gulf energy while avoiding direct conflict with Washington.
Taiwan. Taiwan has 11 days of LNG reserves in emergency storage, and TSMC accounts for 9 to 10 percent of the island’s total electricity consumption. Morgan Stanley has estimated that several weeks of additional LNG cargo are in transit to Taiwan, purchased at significant premiums. The island has enough oil and helium for now. What it does not have is a plan for month five if the Hormuz closure persists.
Singapore. Singapore’s Foreign Minister Vivian Balakrishnan issued an unusually stark public warning on March 22 that the war threatens to send Asian economies into crisis. Singapore is the world’s top bunkering hub; its fuel distributors have been cutting back purchase volumes due to extreme price fluctuations. The Singapore Refining Company has reduced operations to roughly 60 percent of capacity. ExxonMobil’s Jurong Island refinery has dropped to approximately 50 percent.
Malaysia. Malaysia’s Pengerang Refining Company, a joint venture between Petronas and Saudi Aramco, closed its 300,000 barrel per day processing unit due to crude supply shortfalls. Canada’s LNG Canada facility at Kitimat, British Columbia is being cited explicitly by Malaysian and broader Southeast Asian energy buyers as the most strategically important alternative LNG supply option, precisely because it routes LNG to Asia without transiting the Strait of Hormuz.
Indonesia. Indonesia faces the most structurally complex exposure of any economy in this analysis. It is the world’s largest nickel producer, meaning its battery materials processing economy is directly constrained by the sulfur supply disruption. Its agriculture sector, with farming contributing approximately 10 percent of GDP and a third of all employment, is exposed to fertilizer supply disruption. The government is accelerating investment in pyrometallurgical nickel processing alternatives to reduce structural dependence on Gulf sulfur. The timeline for that pivot is years, not months.
Canada. TC Energy CEO Francois Poirier stated at CERAWeek on March 23 that the conflict makes a second phase of LNG Canada more likely, explicitly framing Canada’s Pacific-access LNG infrastructure as strategically significant because it delivers LNG to Asia without transiting the Strait of Hormuz. Energy Minister Tim Hodgson’s office confirmed that the minister is receiving calls from countries interested in Canada’s energy exports. LNG Canada Phase 2, if approved, would double the facility’s capacity to approximately 28 million metric tons annually.
The United States. The United States is simultaneously the initiator of the conflict and one of its most complex domestic economic victims. Gasoline prices have risen approximately one dollar per gallon nationwide. Food and electricity costs are following. A coalition of farming organizations has petitioned the administration for relief from elevated fertilizer input costs. The stagflation dynamic has been formally flagged by Bloomberg and multiple central bank research units as the primary domestic macroeconomic risk. The Dallas Fed’s formal scenario modeling projects global real GDP growth reductions of 0.2 to 1.3 percentage points depending on conflict duration, and that model explicitly does not include the natural gas, fertilizer, condensate-naphtha, petrochemical, or pharmaceutical cascades described in this article.
North Korea. Pyongyang issued an unusually strong Foreign Ministry statement condemning the U.S. and Israeli strikes, describing the attacks as proof of the necessity of nuclear deterrence and drawing the explicit lesson that Iran’s vulnerability stems from its lack of a nuclear arsenal. The Diplomat assessed the Kim regime as unlikely to undertake reckless military campaigns but highly likely to accelerate nuclear production, deepen military cooperation with Russia and Iran, and issue sharper anti-U.S. rhetoric. North Korea’s deepened cooperation with Russia accelerates a Russia-China-North Korea supply chain and military technology cooperation architecture that operates entirely outside the dollar-denominated Western trade system.
Germany. Germany has now experienced the disruption of both its primary energy supply relationships within four years. European TTF futures at 60 euros per megawatt-hour represent nearly double the pre-war price level. Germany’s industrial sector, the most energy-intensive advanced manufacturing base in Europe, is under compound pressure from both the direct energy cost increase and the feedstock cost increase flowing through European ammonia and petrochemical production chains. The combination of the 500 billion euro German defense investment commitment and the energy supply restructuring now underway will reshape European industrial policy for a generation.
XI. The 30-to-180-Day Disruption Forecast
The disruption cascade is not static. It propagates through supply chains on a lagged timeline, with each successive 30-day window bringing new categories of goods and industries into the acute shortage zone. The core analytical principle is what the supply chain literature describes as short-term shock, long-term transmission: a disruption at the chokepoint propagates into manufacturing, agriculture, and consumer markets with a two-to-four-week lag, with each successive supply category exhausting its buffer inventory and entering shortage territory on a predictable timeline.
Days 1 to 30 (March 1 to March 31). The energy and immediate commodity shock phase. Crude oil and LNG prices spike immediately. Urea and ammonia prices spike within the first week as spring planting season demand collides with supply disruption. Helium inventory drawdown begins for South Korean and Taiwanese chip fabs. Naphtha prices begin their ascent as condensate supply from Ras Laffan and Iran drops out of the market. Emergency reserve releases are authorized by the IEA. Asian refineries begin cutting run rates as crude deliveries slow. Petrochemical force majeures begin at facilities with one month or less of naphtha feedstock inventory. The agricultural calendar enters the window where every day of fertilizer delivery delay translates into a measurable yield penalty for the northern hemisphere spring planting season.
Days 31 to 60 (April 1 to April 30). The agricultural, naphtha, and petrochemical cascade phase. Farmers who could not secure fertilizer at economically viable prices in March begin making planting decisions that reduce acreage or nitrogen application rates. The yield penalty is locked in for the 2026 northern hemisphere grain harvest before the end of this period. Asian steam crackers that held one month of naphtha feedstock are now depleted; those that have not secured alternative supply are shutting down or operating at severely reduced rates. The full co-product shortfall is now visible in every downstream market: polyethylene, polypropylene, synthetic rubber, nylon, polyester, adhesives, solvents, packaging, and automotive components. Pharmaceutical API cost increases are working through into finished medicine pricing. Sulfur inventory at Indonesian HPAL facilities is approaching depletion at the most exposed processors.
Days 61 to 90 (May 1 to May 31). The industrial cascade phase. HPAL nickel facilities at the most exposed Indonesian operations begin curtailing production as sulfur inventory reaches depletion. The nickel price signal begins transmitting into stainless steel and specialty alloy markets, affecting automotive, food processing, pharmaceutical, and construction sectors simultaneously. Generic drug prices in U.S. pharmacies begin reflecting upstream API and packaging cost increases. The European gas storage campaign is running approximately 15 to 20 billion cubic meters behind the trajectory required to reach the 90 percent November 1 legal mandate. Taiwan’s LNG procurement window, secured through to approximately May, is narrowing, and TSMC is actively managing power allocation across its fabrication facilities.
Days 91 to 120 (June 1 to June 30). The food security and currency pressure phase. Northern hemisphere grain harvests begin reflecting the fertilizer application decisions made in March and April. India’s Kharif planting season is fully underway; the adequacy of the government’s emergency urea procurement determines whether physical shortages emerge in specific districts. Currency pressures in import-dependent Asian economies are intensifying as energy and food import bills compound against weakening domestic demand. European industrial energy demand destruction, meaning facilities reducing output or going offline because energy costs exceed production economics, is beginning to appear in PMI data.
Days 121 to 150 (July 1 to July 31). The financial system stress phase. The aggregate impact of months of elevated energy, food, and industrial input costs is now visible in corporate earnings across every sector exposed to supply chain disruption. Insurance markets are repricing political risk premiums globally. Capital formation for long-cycle industrial projects has essentially ceased in the disrupted regions. European gas storage injection is on track to miss the November 1 legal mandate under current trajectory; contingency planning for winter 2026 to 2027 energy rationing is becoming an active governance priority. South Korean chipmakers are approaching the inventory horizon for helium and other flagged materials; alternative supply arrangements from U.S. and Russian sources are operational but at significantly elevated cost.
Days 151 to 180 (August 1 to August 31). The structural reconfiguration phase. The disruptions described throughout this article have been sustained long enough that they are no longer being treated as temporary shocks by corporate and government capital allocators. They are being treated as structural features of the new supply chain environment, and investment decisions are being made accordingly. Domestic ammonia production projects in the United States, previously waiting for 45V tax credit clarity, are advancing to Final Investment Decision under national food security framing. LNG Canada Phase 2 discussions are accelerating. European green and blue ammonia capacity is being approved at accelerated timelines. The reconstruction engineering assessments for Ras Laffan and South Pars, covering not just the LNG trains but the condensate processing infrastructure, the naphtha fractionation units, the sulfur recovery systems, and the ammonia and methanol synthesis loops, are complete, and preliminary procurement processes are beginning.
XII. The Macroeconomic Environment: The Stagflation Trap
Across all the molecular cascades described in this article, the macroeconomic aggregate is the same: rising input costs throughout the productive economy, including energy, food, industrial chemicals, structural metals, pharmaceutical precursors, plastics feedstocks, and packaging materials, combined with demand weakness from consumer uncertainty and the compounding effect of tariff-driven price increases that preceded the conflict.
The Federal Reserve entered this conflict already navigating inflation above its 2 percent target and a labor market showing signs of softening. The standard central bank response to commodity-driven inflation, raising rates, simultaneously deepens demand-side weakness. The standard response to demand weakness, reducing rates, adds fuel to inflationary pressure. There is no clean exit from that trap when the inflation driver is molecular: a physical shortage of ammonia, sulfur, helium, methanol, naphtha, and pharmaceutical precursors that monetary policy cannot increase.
PMI surveys released on March 24 showed the preliminary eurozone composite index dropping to a 10-month low of 50.5 in March, with both input and output prices in eurozone manufacturing exhibiting significant fluctuations. The Dallas Fed’s formal scenario modeling projects global real GDP growth reductions of 0.2 percentage points at one quarter of disruption, rising to 1.3 percentage points if the disruption persists for three quarters, and that model explicitly does not include the natural gas, fertilizer, condensate-naphtha, petrochemical, or pharmaceutical cascades. Multiple observers are already drawing comparisons to the 1970s stagflation episode. The true macroeconomic impact of a six-month disruption, capturing all of the molecular cascades described in this article, has not yet been modeled in any publicly available framework. It is larger than the headline numbers suggest.
XIII. The Long-Term Restructuring of Global Industrial Trade Architecture
The most consequential dimension of the current disruption may not be the immediate supply shock. It may be the structural realignment in global industrial trade architecture that the shock is now accelerating.
China’s mBridge digital currency platform has processed over 55.5 billion dollars in cumulative settlements outside the SWIFT dollar architecture. CIPS connects 119 countries. ASEAN adopted a formal five-year plan at the May 2025 Kuala Lumpur summit to reduce dollar dependence and maximize local currency settlement across the bloc. Russia’s bilateral trade with China reached a record 244.8 billion dollars in 2024, almost entirely settled in yuan and rubles.
Russia is the principal commodity beneficiary of the current disruption. It is now the marginal energy supplier to every Asian economy scrambling to replace Gulf crude. It is the marginal fertilizer supplier to countries locked out of Gulf urea. It is the marginal helium supplier to South Korean chipmakers conducting emergency procurement. The settlement architecture of these transactions has changed; their commercial volume has not.
South Korea’s emergency helium procurement from Russian suppliers represents not just a supply chain decision but a recalibration of its foreign policy dependency calculus. These decisions, made under immediate duress, have structural persistence. They do not reverse when the conflict ends. Japan holds 1.23 trillion dollars in U.S. Treasury bonds; gradual reallocation of new reserve accumulation into gold and alternative currency assets constitutes a structural shift whose effects on U.S. long-term interest rates will compound quietly over time.
For industrial companies with global customer bases, technology licensing relationships, and capital investment programs that cross multiple jurisdictions, this restructuring is not an abstract geopolitical observation. It is a commercial planning variable.
XIV. The Structural Opportunity: Industrial Technology and the Coming Reconstruction Cycle
The reconstruction demand profile is, by any historical standard, exceptional, and its scope is wider than the LNG-focused coverage suggests. The full reconstruction requirement encompasses two confirmed damaged LNG trains at Ras Laffan, each requiring multi-year reconstruction programs that include SMR units, ammonia synthesis loops, and sulfur recovery facilities in addition to the cryogenic containment infrastructure itself. It includes the condensate processing infrastructure at Ras Laffan, meaning the Laffan Refinery units, the condensate splitters, and the naphtha fractionation systems, which must be reconstructed alongside the gas processing trains if the full value chain is to resume. South Pars reconstruction requirements include not just the gas processing trains but the condensate export systems, the methanol synthesis loops, and the urea production complexes that depended on South Pars feedstock. Iran’s domestic gas processing, ammonia, urea, methanol, and condensate infrastructure will require complete reconstruction at war’s end under any scenario that envisions resumed export capacity. Beyond reconstruction, the ammonia, urea, phosphate, and methanol production capacity being planned or accelerated in India, Brazil, Indonesia, and across ASEAN is driven by the demonstrated vulnerability of Gulf supply dependency. The green and blue ammonia capacity being accelerated across Europe, Japan, and North America is being driven by governments that have now observed, in real time, what food security exposure to a single supply region looks like. LNG Canada Phase 2 is moving toward Final Investment Decision precisely because it provides Pacific-access supply that does not require Hormuz transit. Domestic ammonia production programs in the United States have been permanently reframed from decarbonization investment theses into national food security and supply chain resilience arguments.
Each of these programs requires process technology. Each requires catalysts for steam methane reforming, ammonia synthesis, methanol synthesis, sulfuric acid production, hydrogen processing, and naphtha reforming. Each requires engineering services and technical licensing expertise. Each represents a procurement cycle that begins not when the conflict ends, but when the decision-makers responsible for capital allocation have completed their supply chain vulnerability analysis and committed to diversification. The companies that have done that analysis for their clients now are not competing for the same work as those waiting for the RFP to be issued.
Conclusion: Physical Laws and Policy Timelines
The disruptions described in this article share a common characteristic: they are governed by physical laws and industrial timelines that do not respond to diplomatic intervention, policy announcement, or market reassurance.
Nitrogen fertilizer not applied to corn fields by mid-May does not grow a 2026 crop regardless of what is negotiated in any ceasefire. Helium inventory at South Korean chip fabs counts down at a rate determined by fabrication volumes, not by press releases. HPAL nickel facilities in Indonesia operate until their sulfur inventory is exhausted. Asian naphtha crackers shut down when condensate-derived feedstock runs out, on a one-month inventory horizon. LNG trains at Ras Laffan require three to five years to reconstruct regardless of the commercial urgency of the buyers waiting for their output. Europe’s 60 billion cubic meter gas storage gap does not close because politicians issue statements; it closes only when molecules are injected into physical storage caverns, and the molecules are scarce.
The South Pars and North Field complex was, before February 28, producing daily the gas that heats homes, the condensate that feeds crackers, the methanol that glues buildings together, the ammonia that grows food, and the sulfur that produces the batteries that power electric vehicles, all from a single reservoir system, all transiting a single 21-mile-wide chokepoint. The world’s industrial planners understood this dependency in the abstract. They are now understanding it in practice.
The molecules do not care about policy timelines. They obey stoichiometric ratios, boiling points, catalyst kinetics, geological formation rates, and inventory depletion mathematics. The companies that have mapped these dependency chains in sufficient detail to anticipate where the disruptions flow, where the reconstruction demand builds, and what the restructured industrial trade architecture requires are the ones positioned to capture the structural opportunity embedded in this crisis.
The consequences are only beginning. The analysis required to navigate them is available now, to those prepared to conduct it.
Scott Ortkiese is the founder and principal of Throughline Synthesis Group. He writes atthroughlinesynthesis.com and on LinkedIn and Substack.
This article draws on data and analysis from S&P Global Market Intelligence, Argus Media, CRU Group, East Daley Analytics, Reuters, the Financial Times, Bloomberg, the New York Times, ICIS, UNCTAD, the International Fertilizer Association, the World Food Program, the Dallas Federal Reserve Bank, Oxford Economics, Wolfe Research, Fitch Ratings, Logistics Viewpoints, Baker Donelson, Thomson Reuters, the Center for Strategic and International Studies, the Atlantic Council, Carbon Brief, Germini Energy, Wright Research, the Korea Semiconductor Industry Association, SEMI Taiwan, the Seoul Economic Daily, FoodNavigator, Tom’s Hardware, Fortune, CNBC, War on the Rocks, The Diplomat, the Carnegie Endowment for International Peace, the Cato Institute, the American Chemical Society, Chatham House, ThinkGlobalHealth, PharmaSource, the Indonesia Nickel Forum, QatarEnergy public disclosures, the Energy Policy Research Foundation, University of Illinois agricultural extension research, and technical literature on Haber-Bosch chemistry, cryogenic air separation, gas condensate processing, HPAL metallurgy, LNG infrastructure engineering, pharmaceutical API manufacturing, ethylene cracker feedstock economics, and petrochemical co-product slate analysis.
Pre-publication draft, March 25, 2026. Version 2.0. The author welcomes technical review and comment prior to publication.
Related reading
- The War That Broke the AI Boom: Economic and Supply Chain Disruptions from the Iran Conflict
- America’s Suicidal Empire: The Iran War, the Death Spiral of a Failing Hegemon, and the World We Are Destroying
- The Last Blunder: How the US-Israel Attack on Iran Killed the American Empire's Operating System
- US-Israeli Attack on Iran Will Trigger Starvation