

Scott Ortkiese | Throughline Synthesis | Houston, September 21, 2026
Trump hosts Xi Jinping at the White House on Thursday, September 24, Xi’s first state visit to Washington in 11 years (Chosun Ilbo). Musk, Pichai, Altman, Cook and Huang are on the state dinner list (Moneycontrol), and administration officials have discussed a separate meeting with the AI executives on the sidelines (CNN). Chip access and accusations of technology copying are on the agenda (Reuters).
Expect Trump to walk out of those rooms and announce a growth miracle. Chips, investment, market access, some number he has invented. Treat it as fabrication on arrival. This is the man who told the country AI could reach “possibly as much as 25% of our Country’s GDP” and that American interest rates “should be 1%, or less” (Trump’s Truth archive).
The executives are not there as partners. They are there as scenery, because they need the same thing he needs. He is the most unpopular president on record on prices and fuel, and their valuations rest on a market that cannot absorb a rate cycle. Both problems are solved, temporarily, by an announcement.
Why he needs it
He is the most unpopular president in the history of American polling on the two things voters say they care about, and it is not close.
Everything below is from CNN’s Harry Enten, September 19 and September 20, 2026, with six and a half weeks left before the vote.
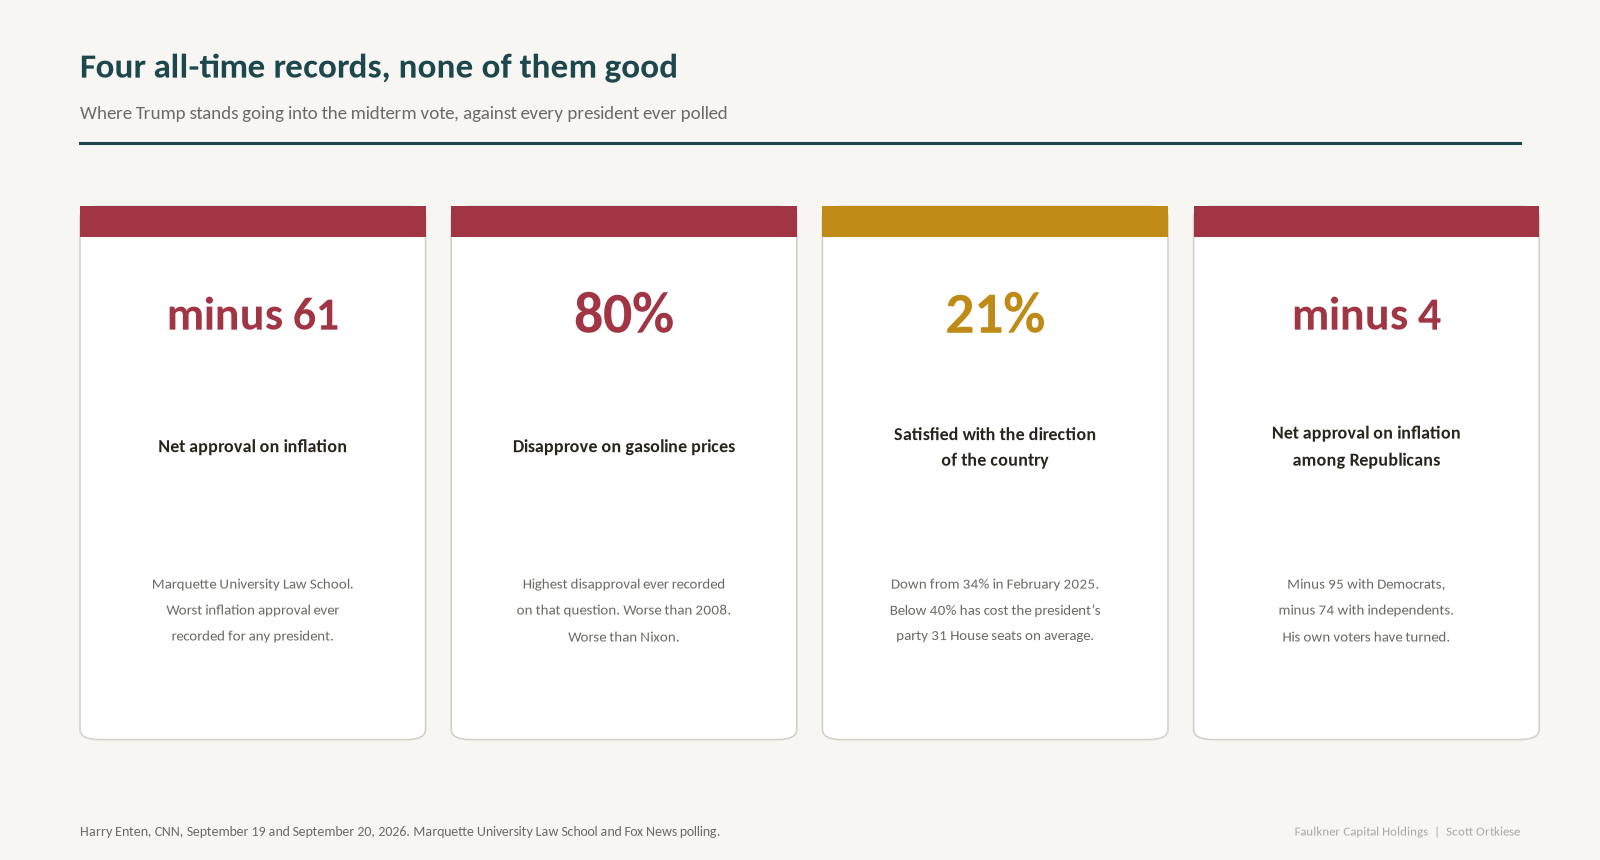
Four all-time records, none of them good
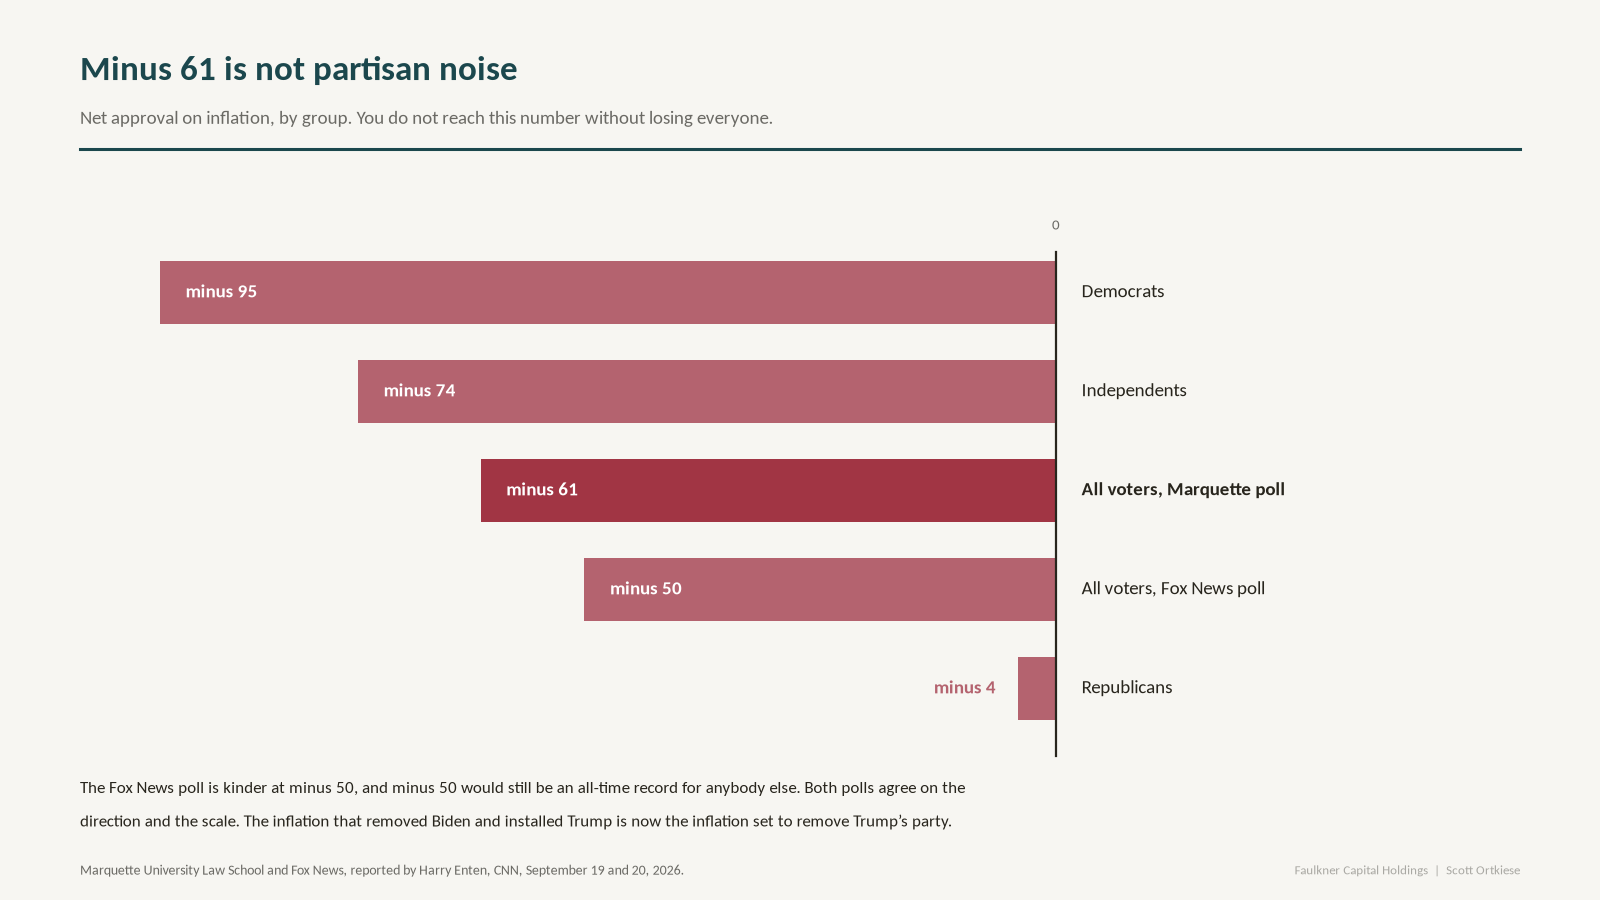
Inflation, minus 61 points. Trump’s net approval on inflation in the Marquette University Law School poll is 61 points underwater. That is not his personal worst. It is the worst inflation approval ever recorded for any American president. Worse than Carter. Worse than Reagan. Worse than Biden. The Fox News poll is kinder at minus 50, and minus 50 would still be an all-time record for anybody else. Both polls agree on the direction and the scale.
Every partisan group, including his own. You do not reach minus 61 with partisan noise. You reach it by losing everyone: minus 95 with Democrats, minus 74 with independents, and minus 4 with Republicans. His own voters have turned on him on prices. The inflation that removed Biden and installed Trump is now the inflation set to remove Trump’s party.
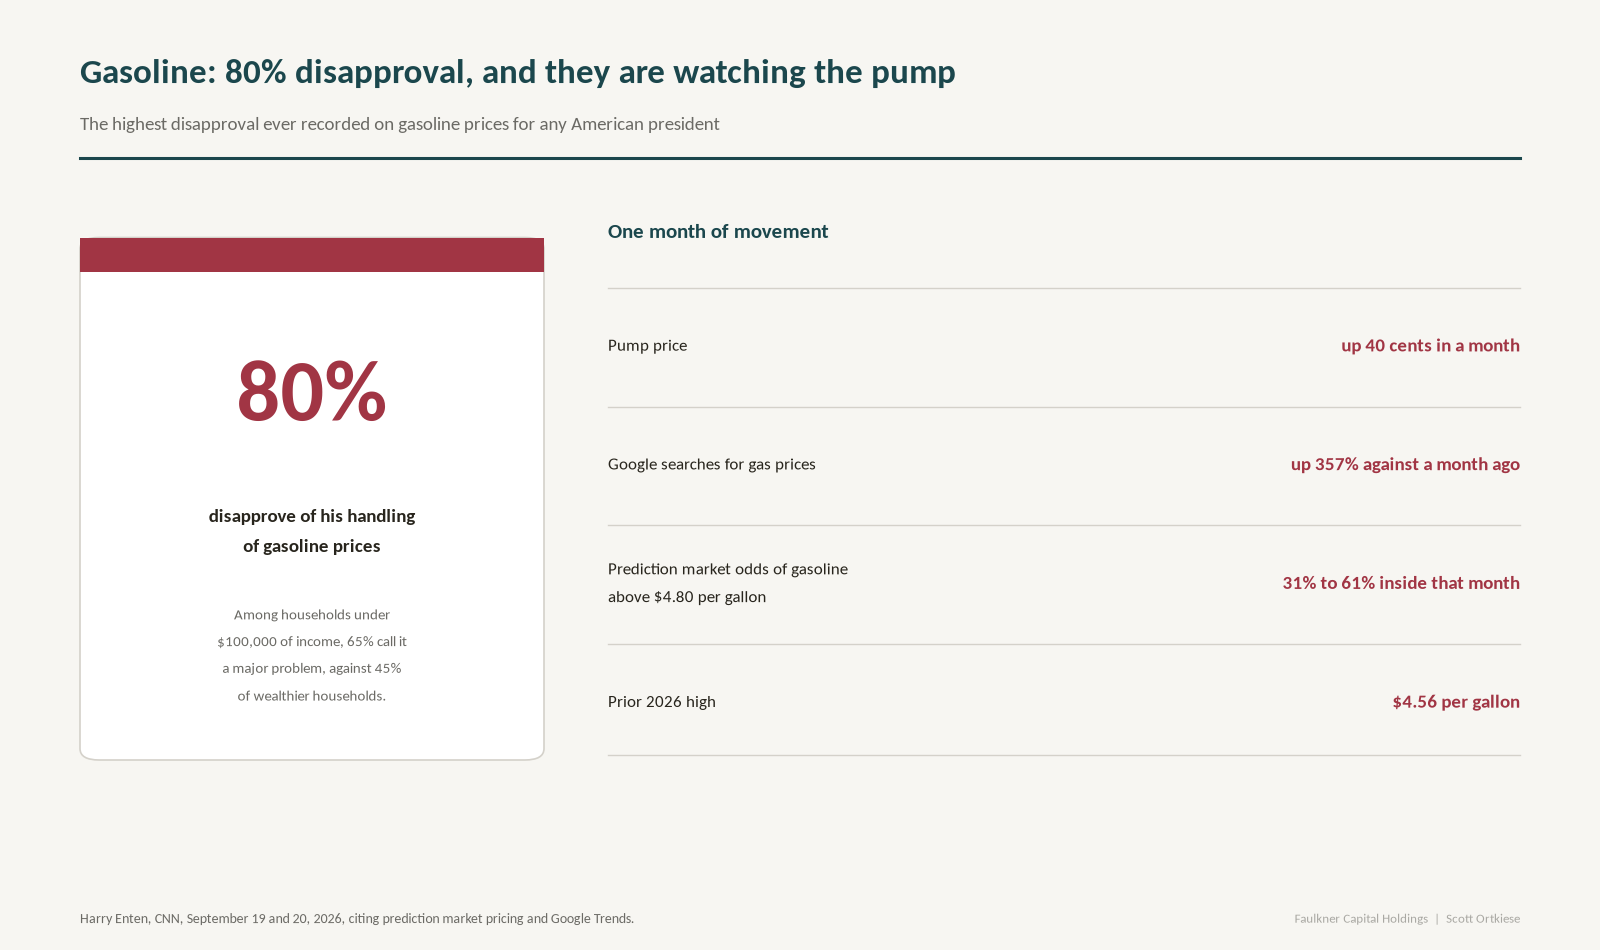
Gas prices, 80% disapproval. 80% of Americans disapprove of his handling of gasoline prices. That is the highest disapproval ever recorded on that question for any president, worse than 2008, worse than Nixon. And they are paying attention: prices up 40 cents in a month, Google searches for gas prices up 357% against a month ago, and prediction markets moving the odds of gasoline above $4.80 per gallon from 31% to 61% inside that month, against a prior 2026 high of $4.56. Among households under $100,000 of income, which is his own base, 65% call it a major problem, against 45% of wealthier households.
Satisfaction with the country, 21%. Down from 34% in February 2025. Since 1982, when satisfaction sits below 40% the president’s party loses an average of 31 House seats. Above 40% it gains 2. He is at 21%, which is 19 points below the threshold.
Collapse measured in tens of points, not in drift
These are not soft slides in sentiment. On foreign policy and with Latino voters, the two places he built his 2024 win, every measure has moved against him by 33 to 44 points in under two years. Start with the war.
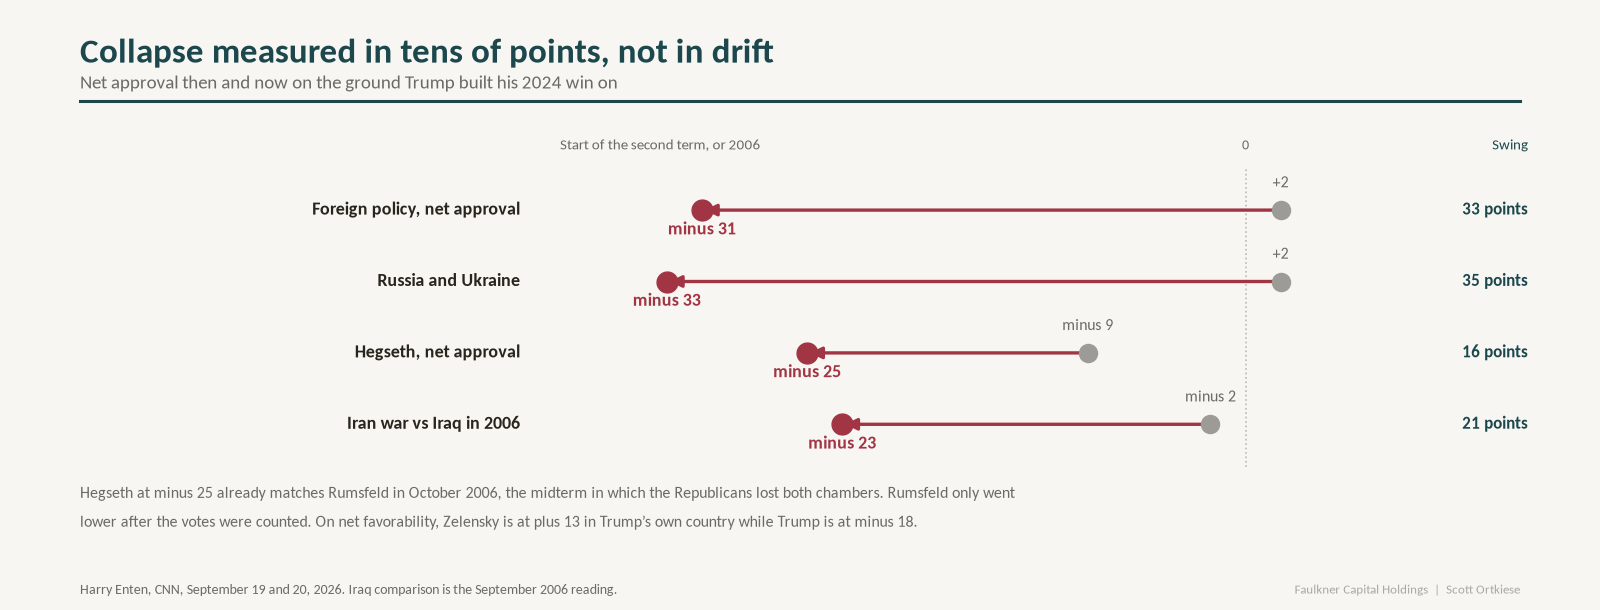
Rumsfeld’s October 2006 reading is the comparison that matters, because that is the midterm in which the Republicans lost both chambers. Hegseth has already matched it. Rumsfeld only went lower after the votes were counted. And the Iran war is a heavier weight now than Iraq was then: minus 23 against minus 2, a war 21 points more unpopular at the same point in the cycle than the one that cost the Republicans Congress.
The Latino collapse
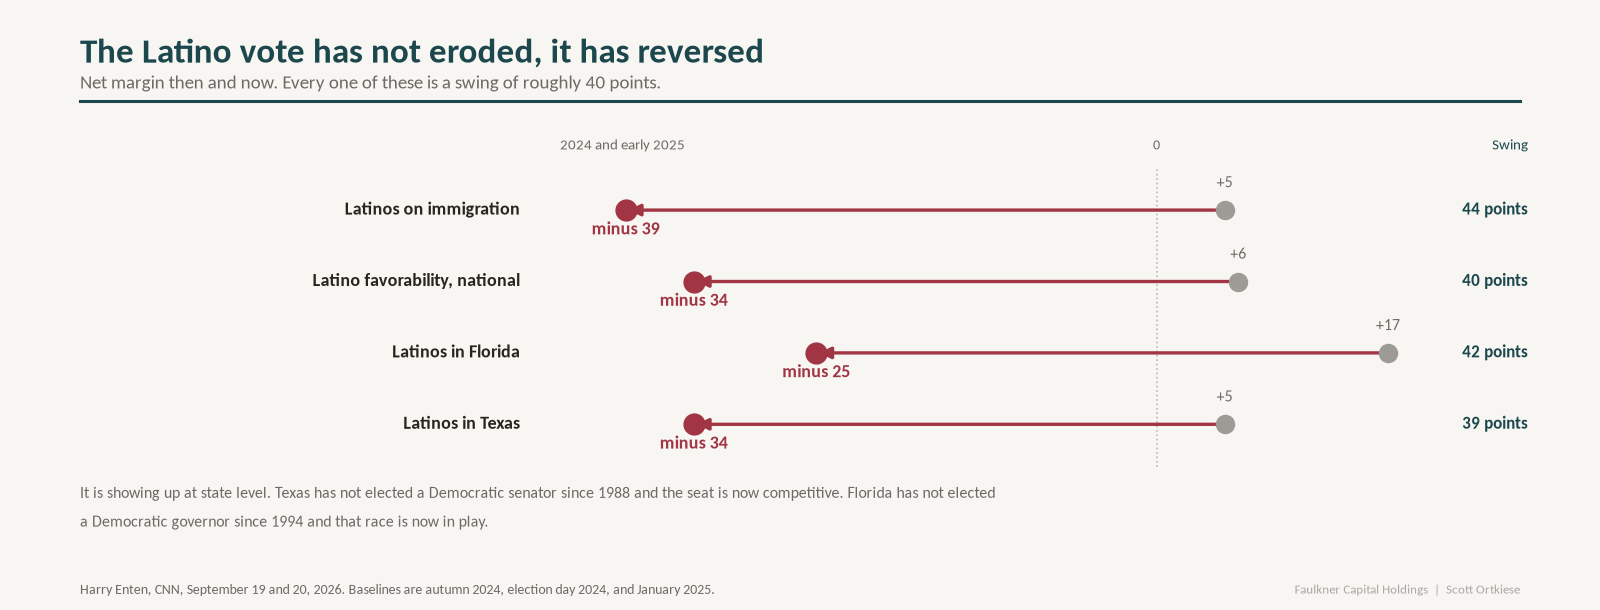
Every one of those is a swing of roughly 40 points. The historically strong 2024 performance with Latino voters has not eroded, it has been erased and reversed. It is showing up at state level: Texas has not elected a Democratic senator since 1988 and the seat is now competitive, and Florida has not elected a Democratic governor since 1994 and that race is now in play.
Eight structural signals, eight the same way
These are the leading indicators that do not depend on asking anybody how they feel. All eight point at a Republican defeat. There is no mixed picture to report.
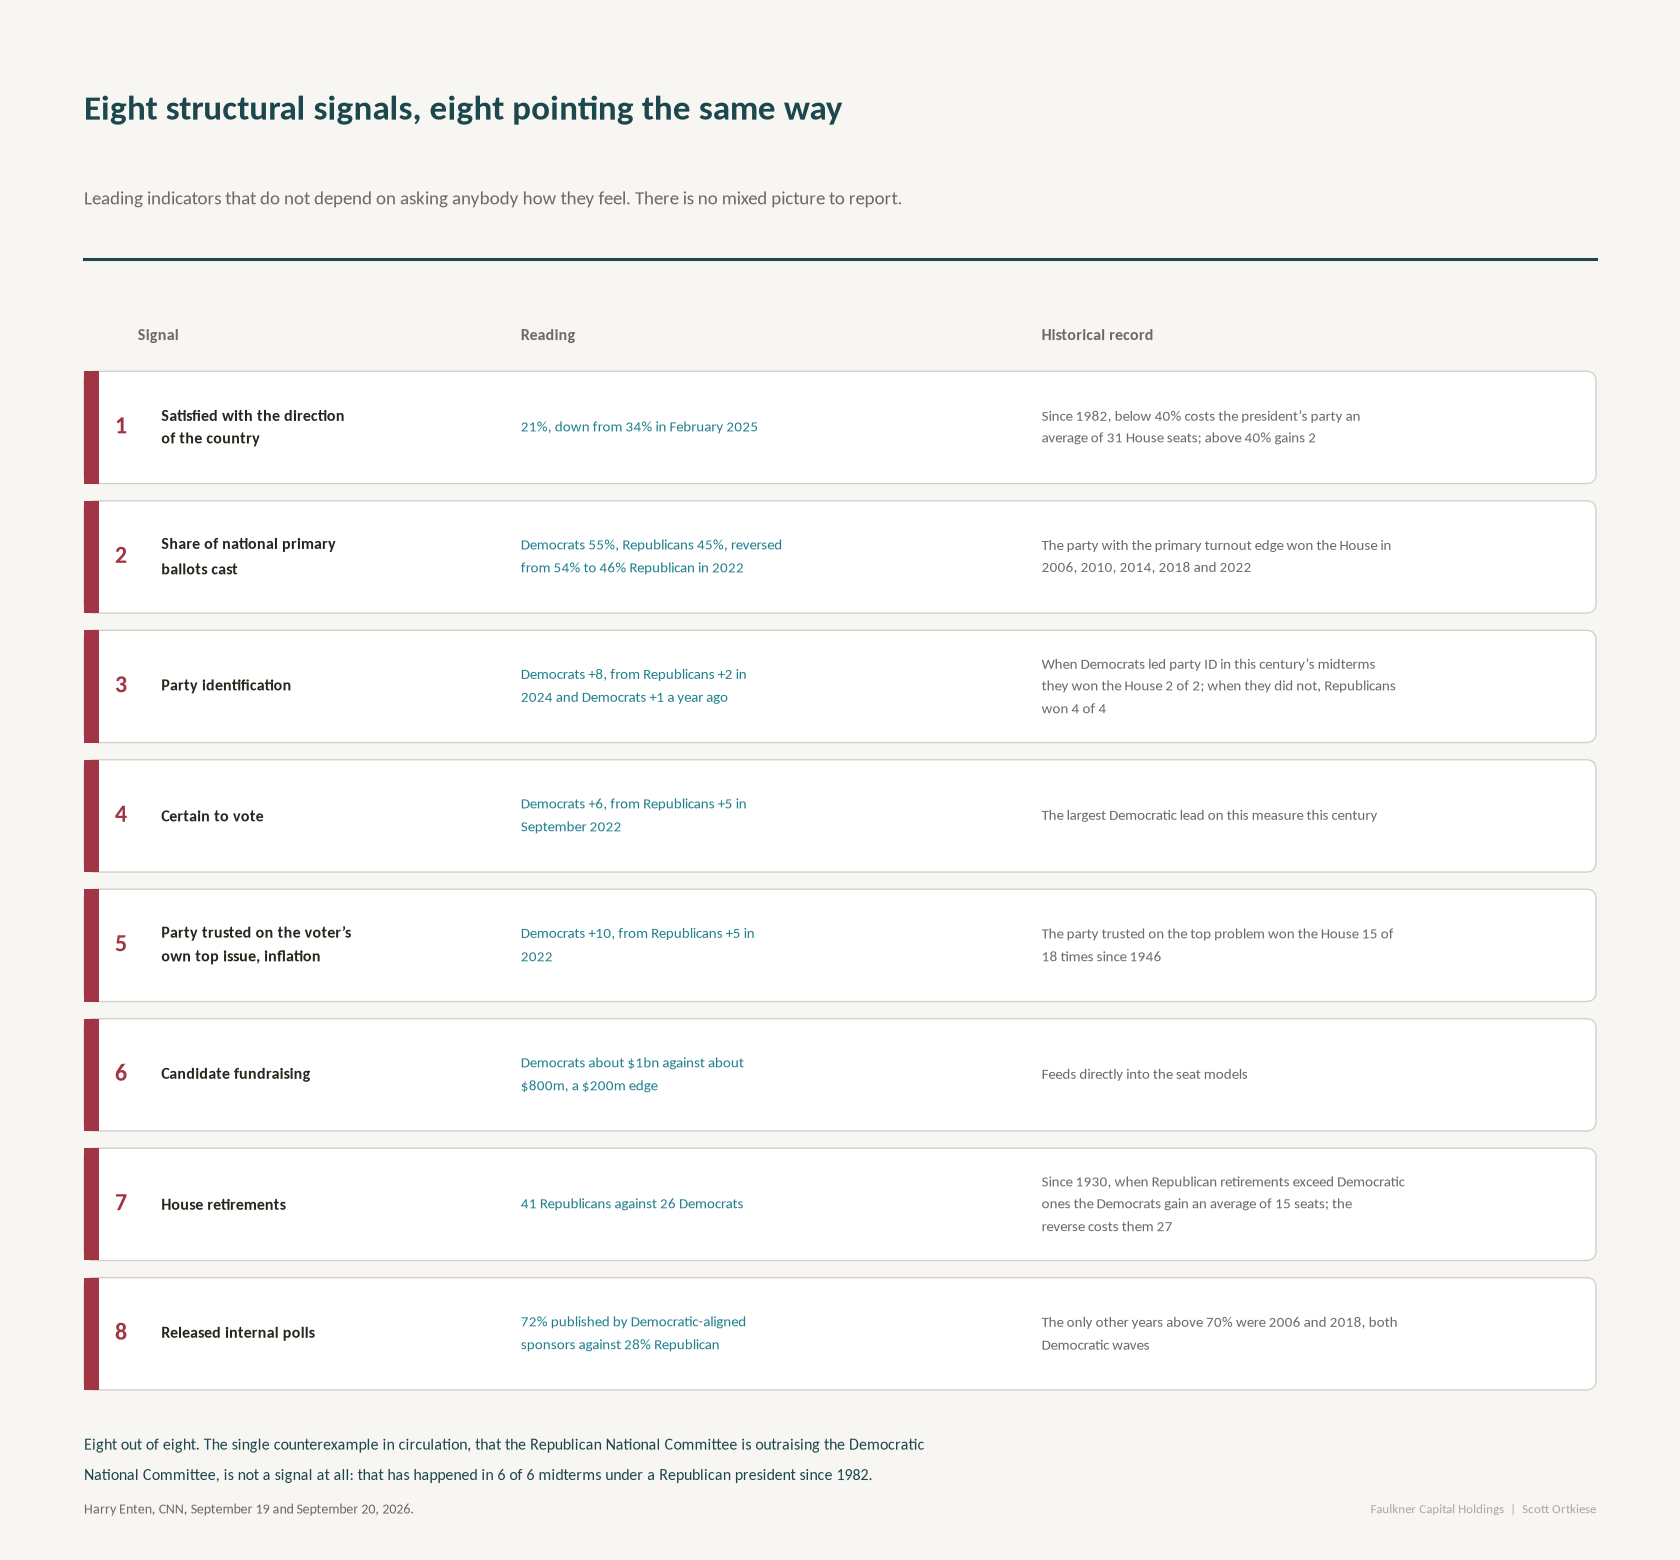
Eight out of eight. The single counterexample in circulation, that the Republican National Committee is outraising the Democratic National Committee, is not a signal at all: that has happened in 6 of 6 midterms under a Republican president since 1982.
The obvious indicators agree
The generic congressional ballot has Democrats up 7 with Fox, up 7 with Reuters and Ipsos, up 8 with the New York Times and Siena, and up 13 with Marquette, averaging north of 7 points. Since 1974, when Democrats led by 5 or more at this stage, they won the House 6 times out of 6.
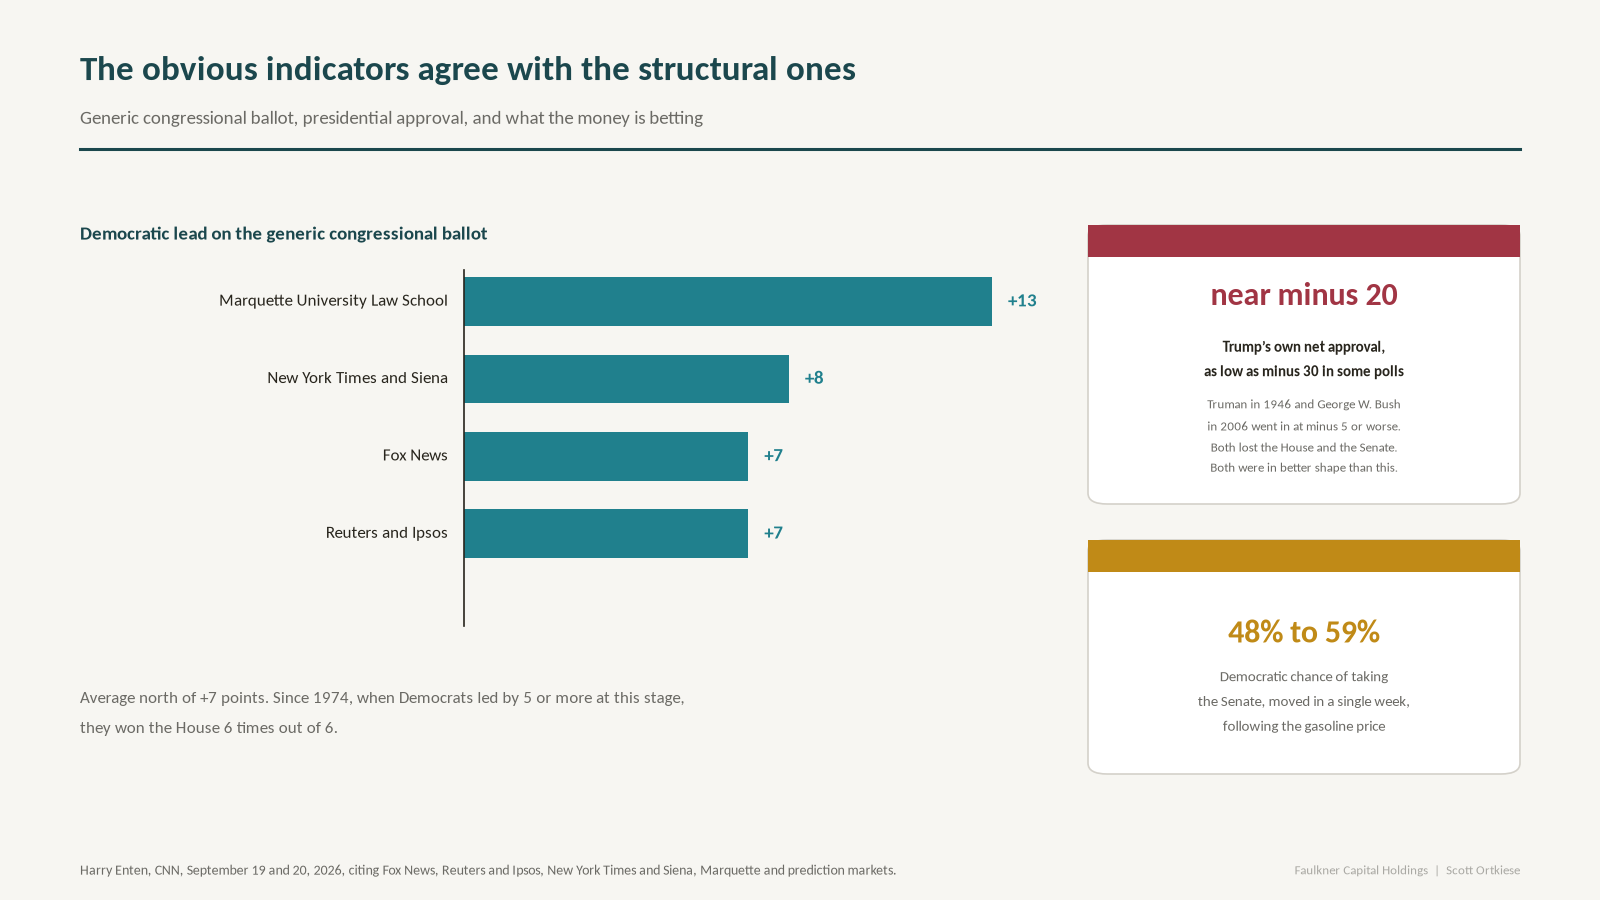
Trump’s own net approval sits near minus 20, and as low as minus 30 in some polls. The presidents who went into a midterm at minus 5 or worse on that measure include Truman in 1946 and George W. Bush in 2006. Both lost the House and the Senate. Both were in better shape than this.
Prediction markets have followed the gasoline price. The Democratic chance of taking the Senate went from 48% to 59% in a single week.
So, the claim is not rhetorical. On inflation, on gasoline, and on satisfaction with the country, this is the weakest position any American president has held going into a midterm since anyone began asking. He set three records at once, and every structural indicator that has ever predicted a midterm agrees with them.
Why the executives need it
Because the market that carries their valuations is thin and getting thinner. The 10 largest companies are now roughly 38% of the S&P 500, the highest concentration since at least the 1970s (MarketXLS). Inflation is running at 3.4% (Bureau of Labor Statistics). On September 16 the Federal Reserve, under Kevin Warsh, raised rates for the first time since 2023, to a range of 3.75% to 4%, and signaled another (CNBC, Reuters). Prediction markets put a December hike at 71%, up from 27% a month ago. The 30-year Treasury yield touched a 52-week high of 5.362% on September 15 (Morningstar).
So, the cost of money is rising while the equity story requires it to fall, and the entire AI buildout is being financed with debt priced off valuations the borrowers themselves set. That is the house of cards. Trump will keep talking it up because talking is the only instrument he has left. Warsh just took the other one away.
Why this lands in Europe
This is the part that is not an American story, and it is not mine; it is the ECB’s.
On August 17, the ECB published its own assessment of the AI boom, written by five of its economists. Euro area households hold about €440bn of exposure to US technology equities, mostly indirectly, through index trackers and ETFs, which means, in the ECB’s words, they “may not necessarily be aware of the associated concentration risk.” Insurers and pension funds hold significant exposures to the same seven companies. Because the exposure runs through funds, a correction forces selling to meet redemptions, which pushes prices down further, which triggers more redemptions. The ECB calls that a financial stability question for the euro area, not a private investment matter.
Two more findings from that piece. Compared with the dot-com episode, there is markedly less room now to cut rates or use fiscal policy to cushion the fall. And European valuations being lower offers no protection, because the two markets have always moved together.
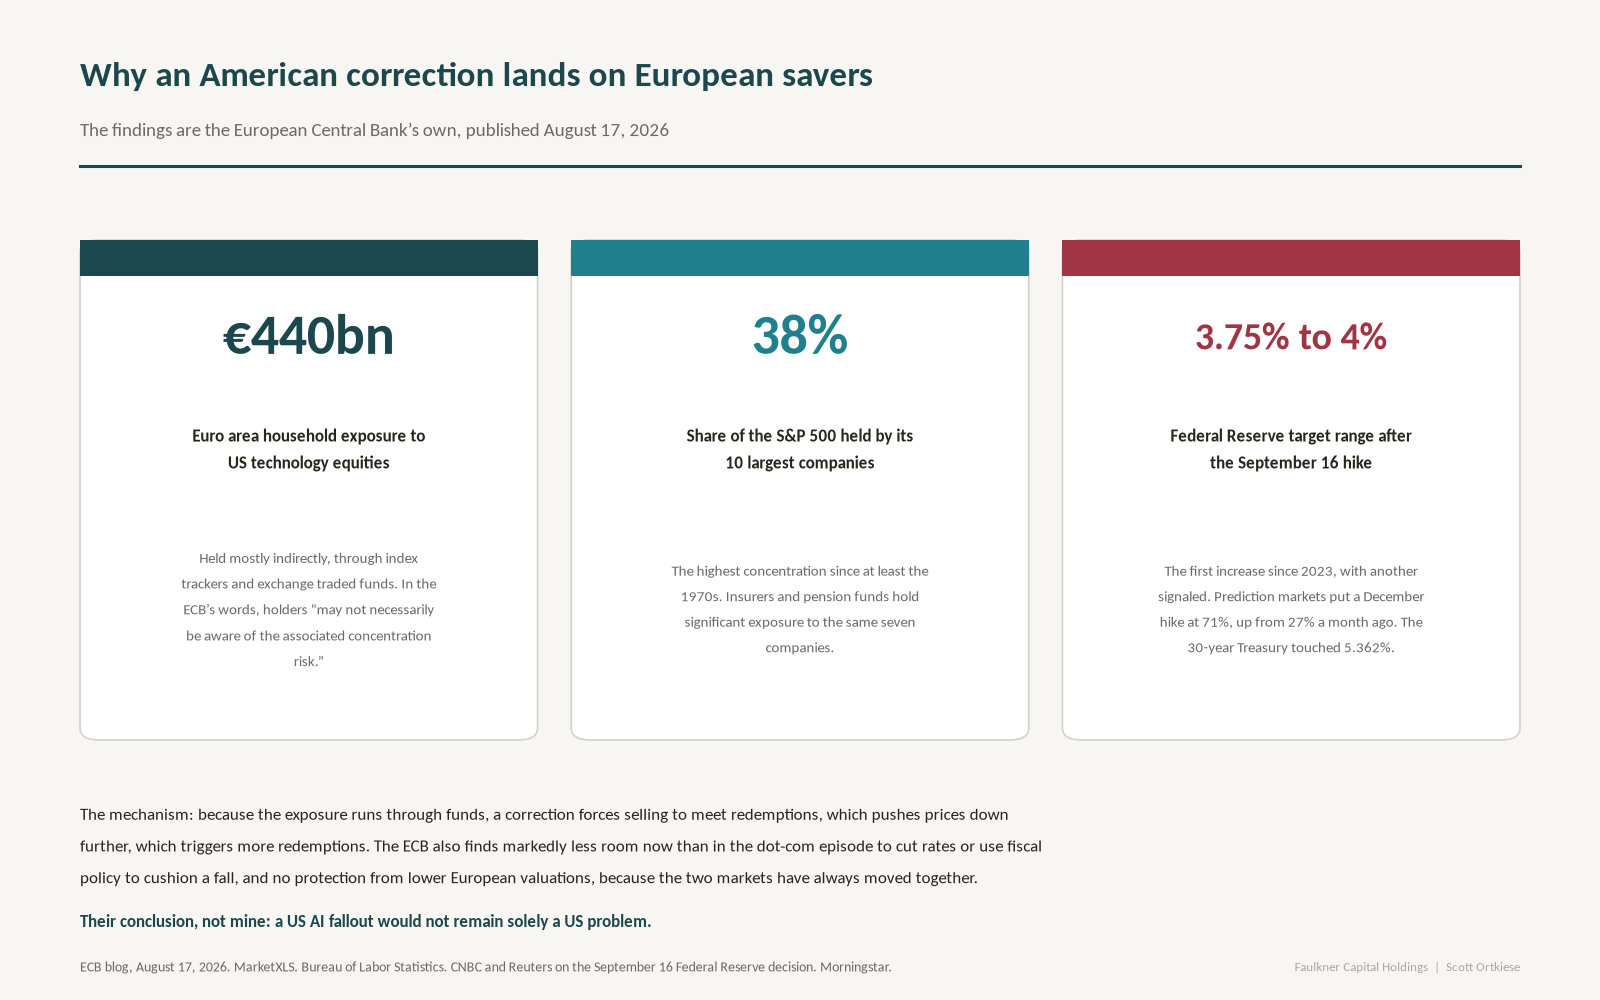
Their conclusion, not mine: a US AI fallout would not remain solely a US problem.
The point
Brussels is being asked to treat American AI capital spending as an industrial achievement Europe failed to match. It is closer to a financing structure that needs an exit, and the exit runs partly through European savings, held by people who never chose the risk and were never asked.
That is a supervisory question, and a democratic one. It does not require anyone to be a finance person. It requires reading what your own central bank published five weeks ago.
Polling figures throughout are as reported by Harry Enten of CNN on September 19 and September 20, 2026, drawing on the Marquette University Law School, Fox News, Reuters and Ipsos, and New York Times and Siena surveys, together with prediction market pricing and Google Trends. The European findings are from the European Central Bank blog post of August 17, 2026. Correspondence to so@throughlinesynthesis.com.